
Node-RED Quickstart Part 2
Following on from Part 1, this tutorial will show you how to use the Node-RED dashboard nodes to build your own Mission control dashboard for the Mayflower Autonomous Ship. If you haven’t already, follow the instructions in Part one to get your map set up and nodes installed.
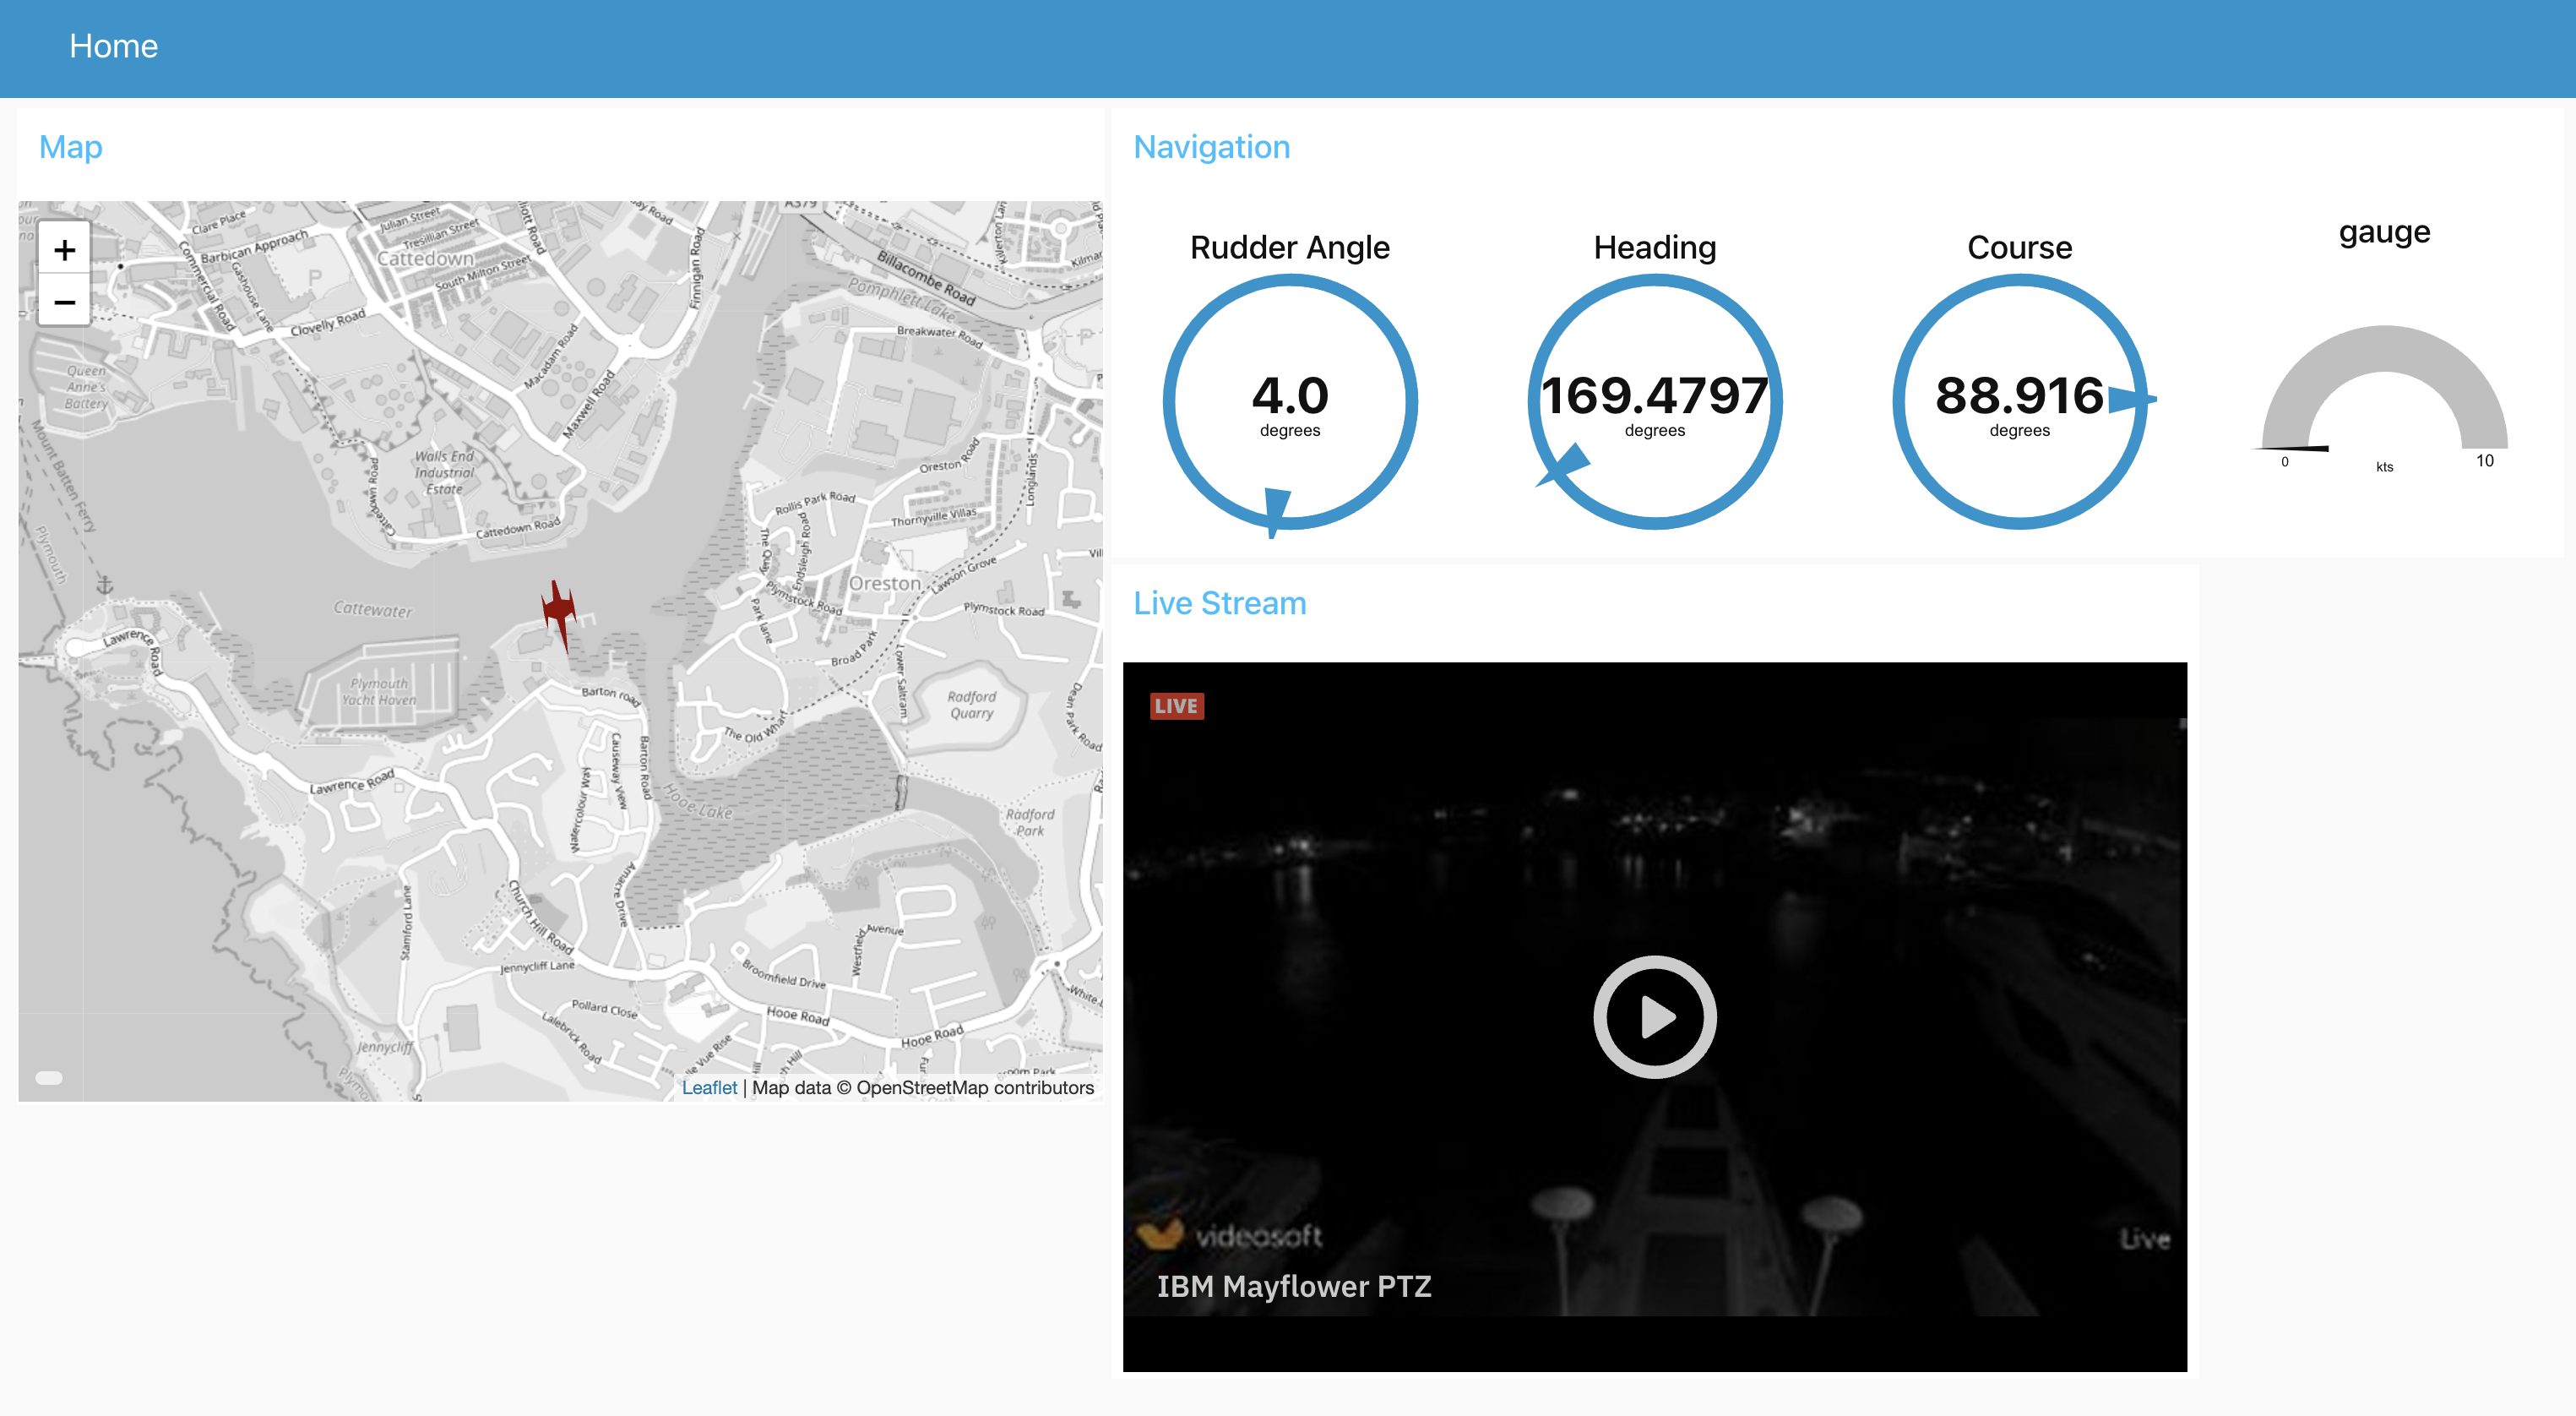
By the end of this tutorial, you should have something like the picture below!
Step 1. Switch to the Worldmap Dashboard Node
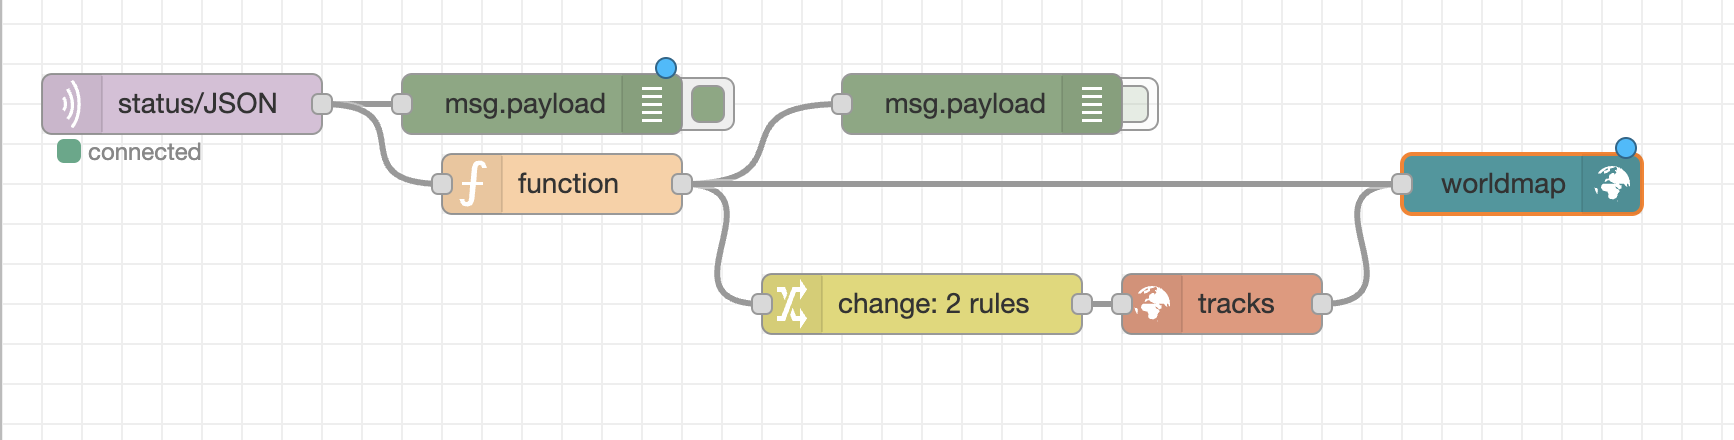
We need to switch out the worldmap node for a worldmap dashboard node. This will add a mini version of the map into our new dashboard.
Delete the Worldmap In Node, and replace it with the worldmap in node that sits in the dashbaord section of the pallet.
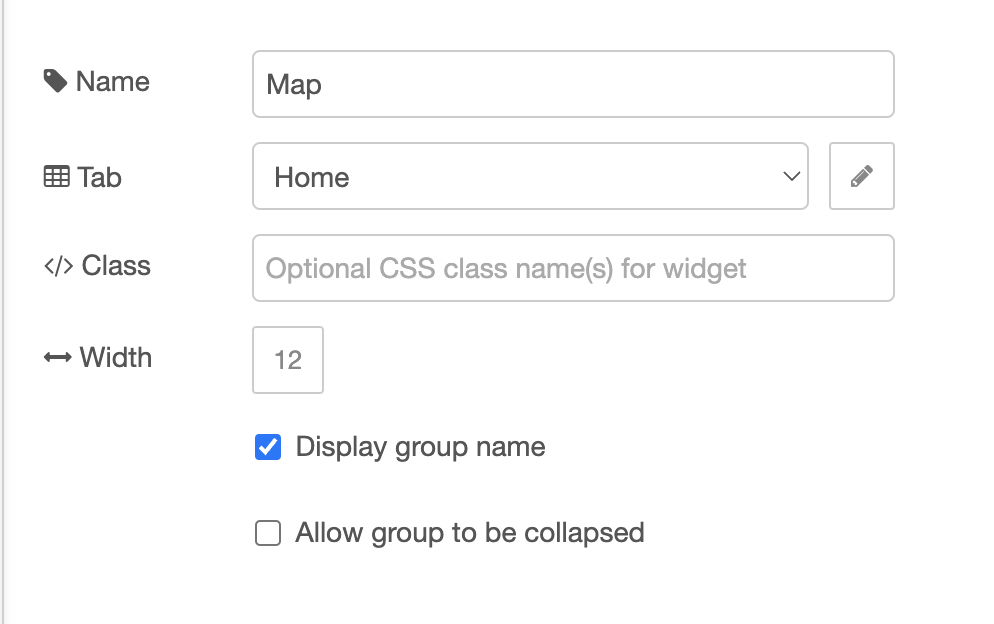
Once you’ve done that, you’ll need to edit the node settings and set up the dashboard page and tabs. For the tab that the map sits on, change the width to 12 cells so that it’s a good size.
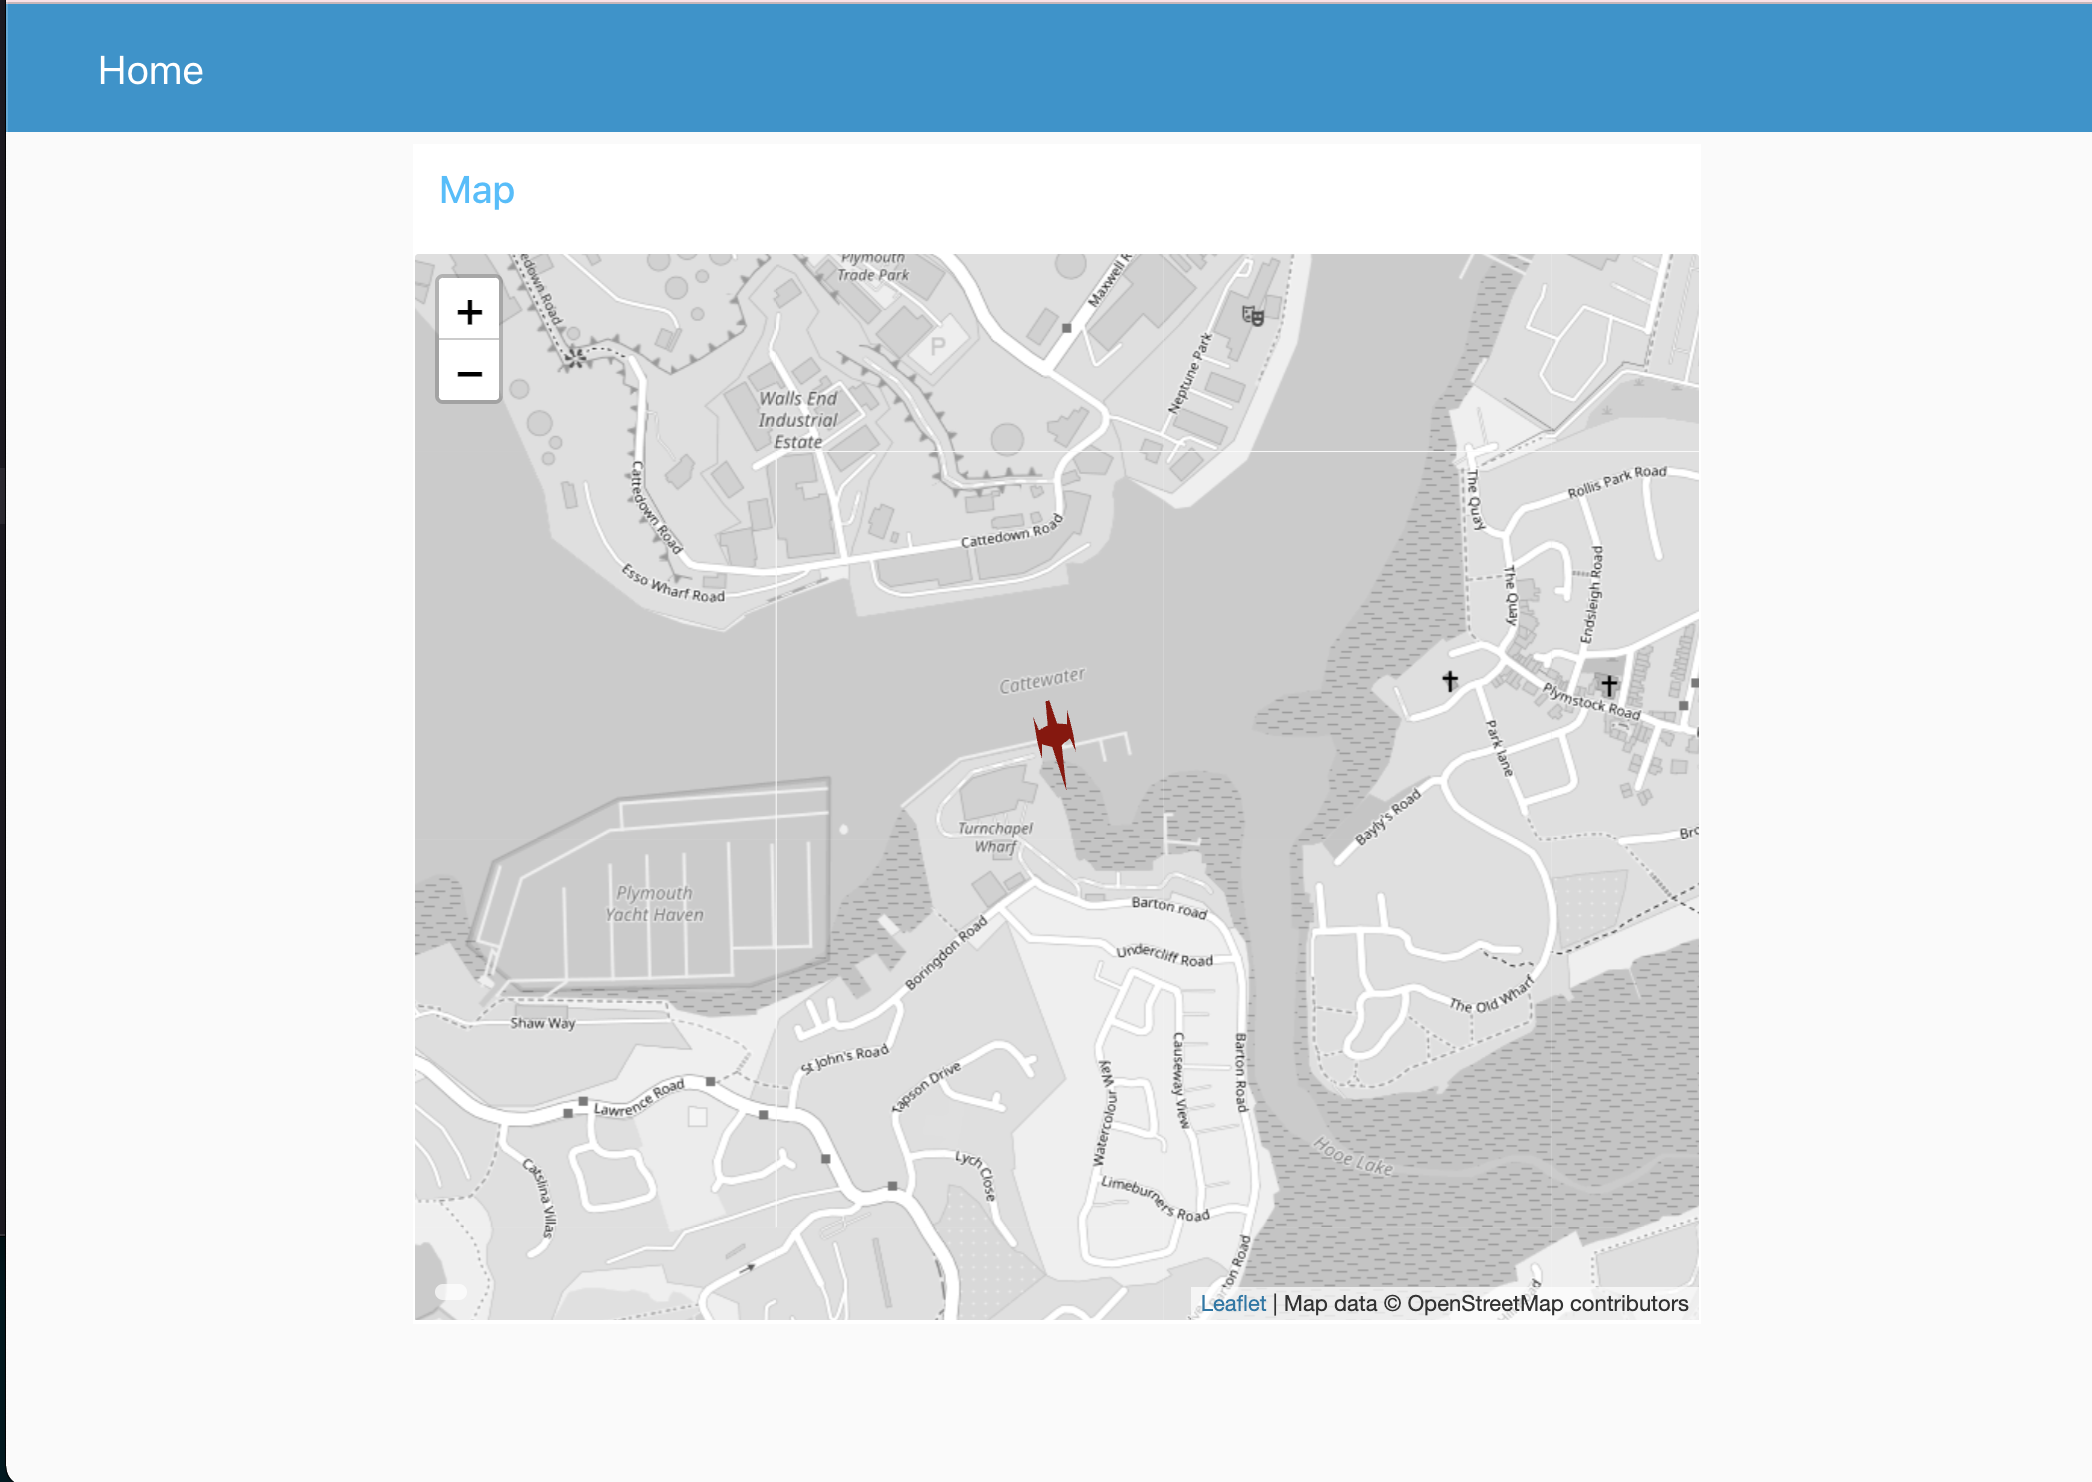
Click Deploy and then go to /ui or press ⌘⇧d - ctrl-shift-d and the dashboard should open up:
Step 2. Speed, Bearing and Rudder
Lets set up some guages that show us the current speed, course and the rudder position of the MAS.
- Add a change node onto the canvas and draw a line from the MQTT in node to the change node.
- Change the Name to something like
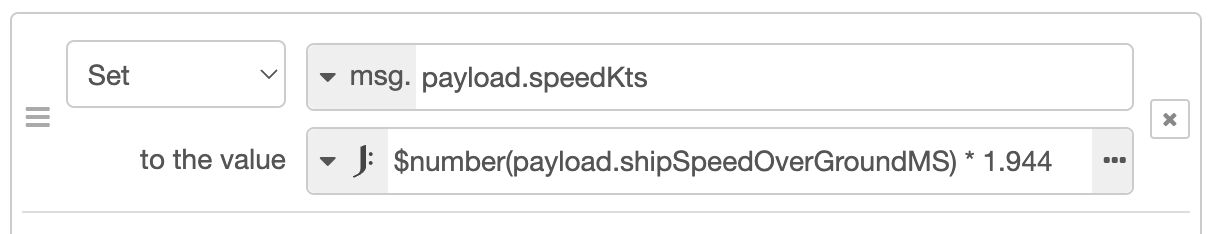
Format Data - Open the Change node properties
- Change the type to
payload.speedKts - Change the type from a/z to expression
- Set the value to
$number(payload.shipSpeedOverGroundMS) * 1.944(This will convert from m/s to knots)
- Change the Name to something like
- Drag four Guage nodes onto the canvas and draw three wires from the change node to each of them.
- Set the Guage nodes up with a new Nagivagion Group on the Home Tab (12 wide as wel)
- Modify each Guage with the following (Also, set the size to 4x4):
- Speed:
- Set the Value to ``
- Set the Unit to
kts
- Course:
- Set the Value to ``
- Set the Units to
degrees - Set the range to 0-360
- Set the Type to Compass
- Heading
- Set the Value to ``
- Set the Units to
degrees - Set the range to 0-360
- Set the Type to Compass
- Rudder angle:
- Set the Value to ``
- Set the Units to
degrees - Set the Type to Compass
- Speed:
- Now Click deploy and you should see the following on your dashboard:
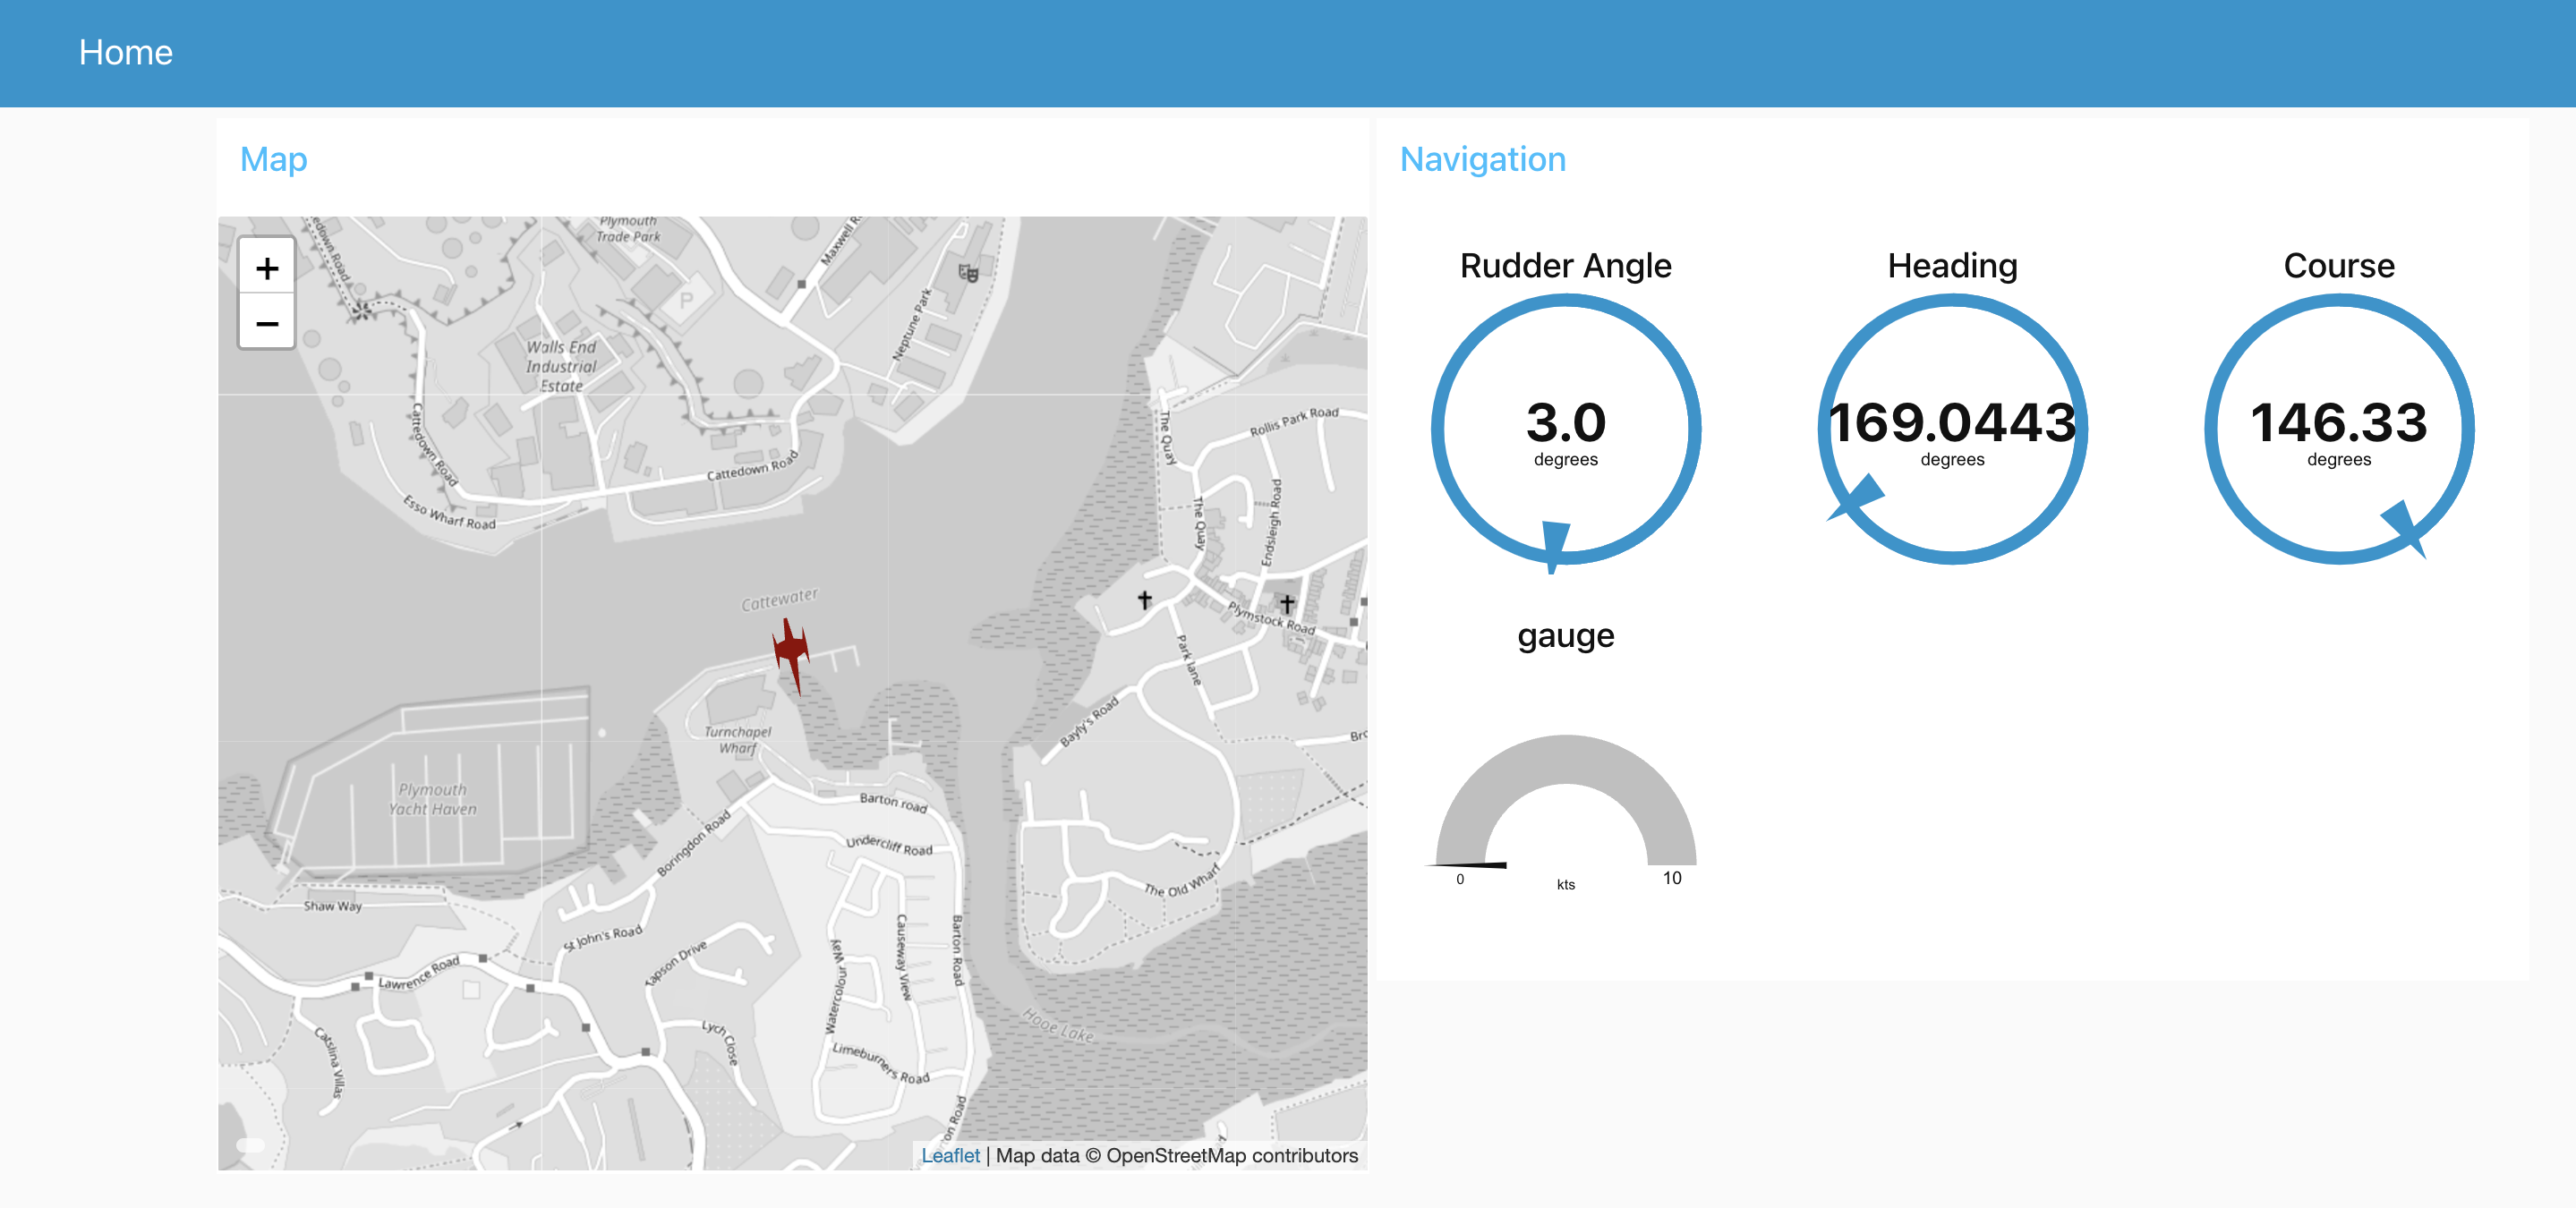
Now you might be asking, Whats the difference between course and heading?.. Great question! Heading is the direction that the MAS wants to be traveling in, whereas course is the direction that the MAS is actually traveling in. When out at sea, tides, currents and the wind can all change how the MAS behaves in the water, so these two values are linked, but paint an interesting picture for how the MAS is traveling and planning its course.
Step 3. Live Stream
Nearly there! Lets add the Video Live stream from the MAS to the dashboard.
- Drag a template node onto the dashboard, you can leave it un-connected.
- Go into its settings and add a new group for the live stream, 12 wide again.
- Set the size to 12x8
- Copy the following into the text field:
<iframe height="100%" src="https://www.ustream.tv/embed/24088054"
     scrolling="no" allowfullscreen webkitallowfullscreen frameborder="0"
    style="border: 0 none transparent;">
</iframe>
- Click Done and deploy.
Congratulations, Now you can watch the Live stream, see the MAS on the map and see the navigational data. For extra credit, have a play with the other dashboard nodes and see if you can display some of the other data fields like the weather or solar panel and battery performance. You can also modify the settings for the dashboard to change the colour scheme as well as the layout.