
Node-RED Quickstart
In this Tutorial, you’ll see how you can set up your own map to monitor the location, and status of the MAS in your own custom dashboard built on Node-RED.
Step 1. Install Node-RED
Install and start Node-RED by following the Getting Started instructions. You can install Node-RED on your personal computer, Raspberry Pi or even in the Cloud.
Step 2. Install Dashboard and WorldMap Nodes
Once you’ve got Node-RED up and running, open it in your browser. If its running on your local machine, you will be able to find it on http://localhost:1880.
Next we need to install some extra Nodes, these will add extra functionality to Node-RED, in this case a Dashboard and a Map view.
- Open the Main Menu by clicking on the hamburger in the top right corner.
- Select ‘Manage palette’
- In the panel that opens, select the ‘Install’ tab.
- In the search modules box, search for
node-red-contrib-web-worldmapand click install. - Then, search for
node-red-dashboardand click install.
You should then see an alert pop up in the top middle of the screen showing that the nodes have been installed, they will then be shown in the Nodes tab. You can now click Close.
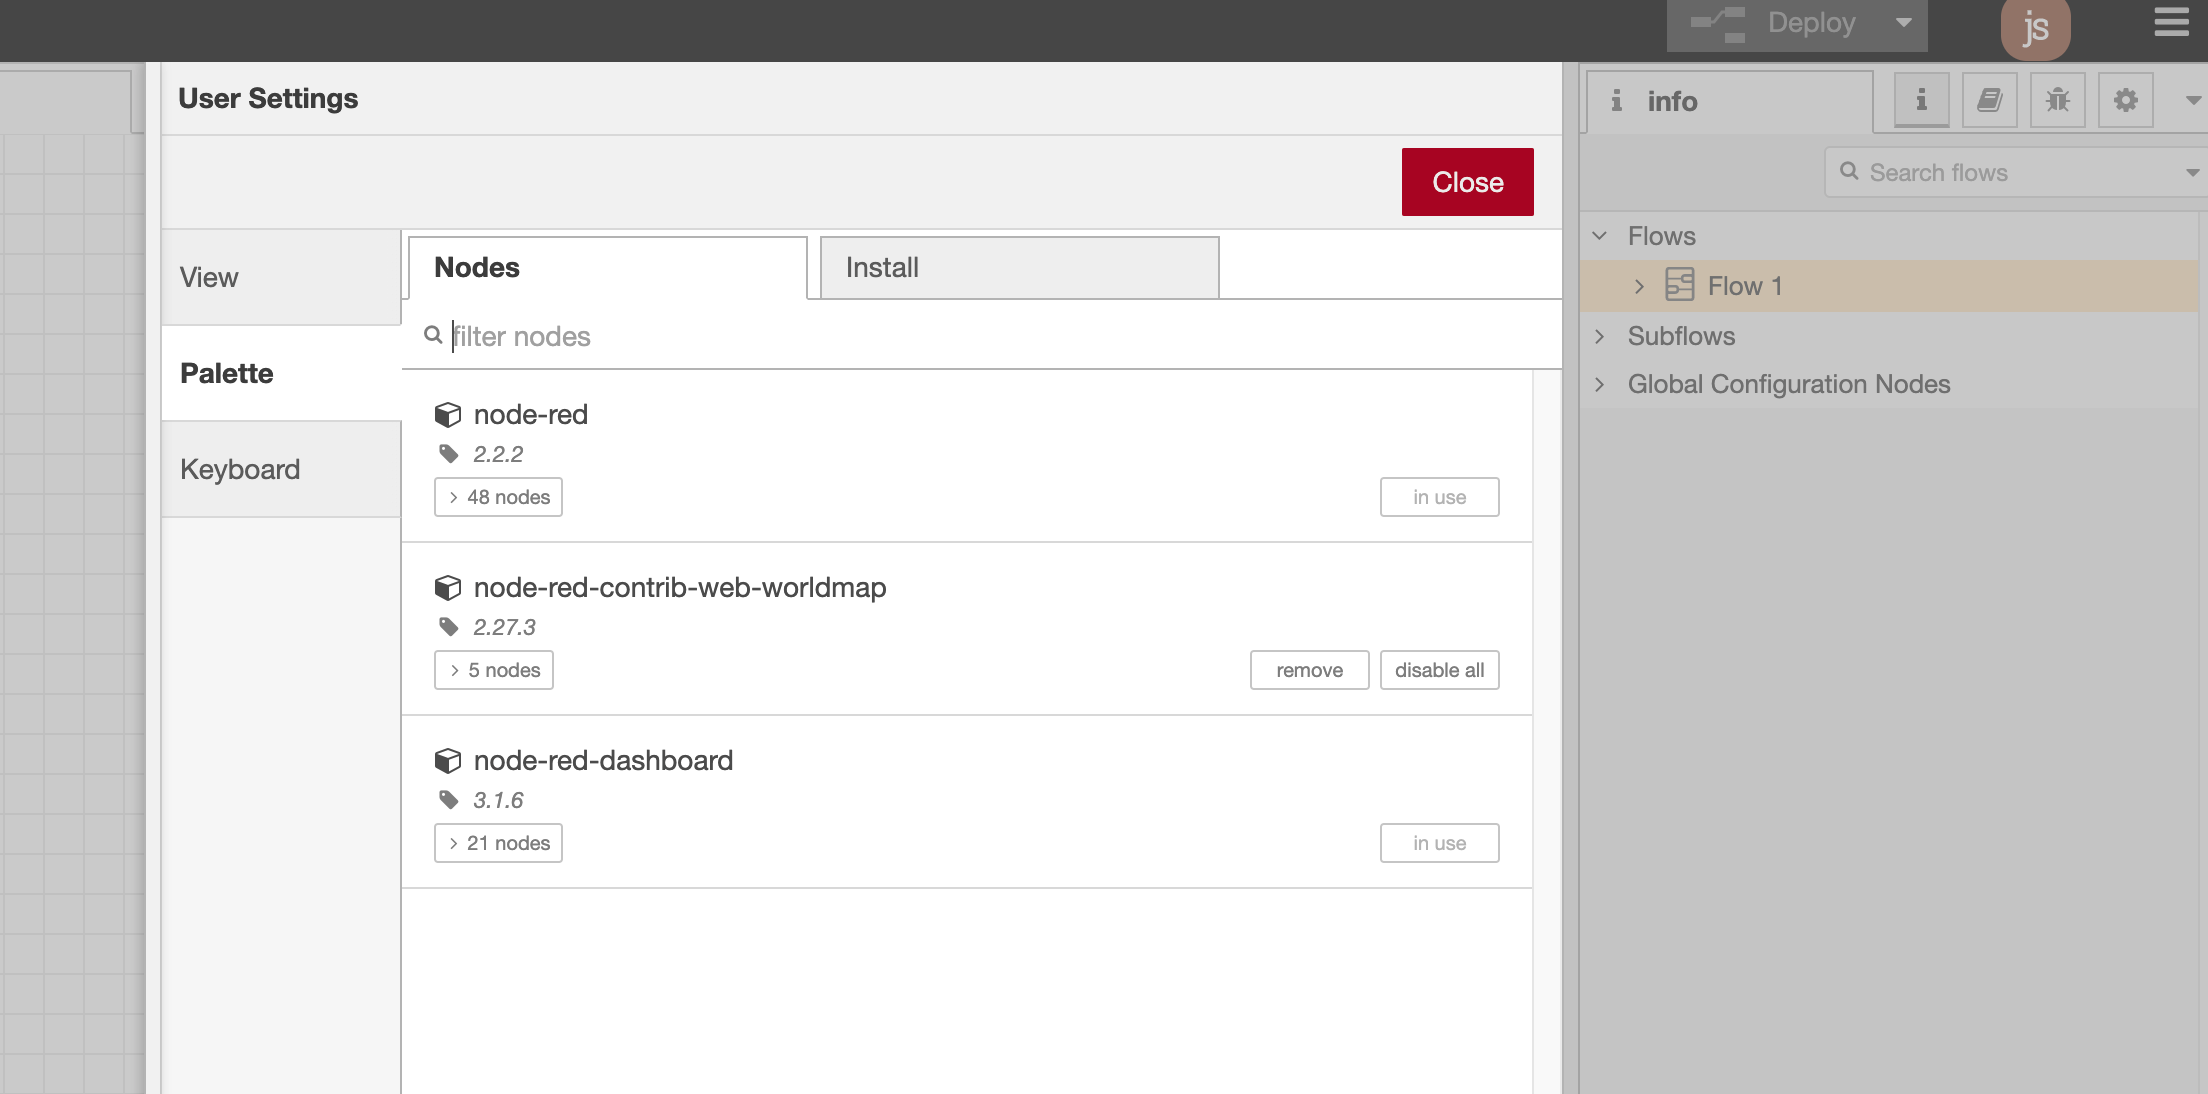
Double check that they are now available in the node palette on the left side of the canvas:
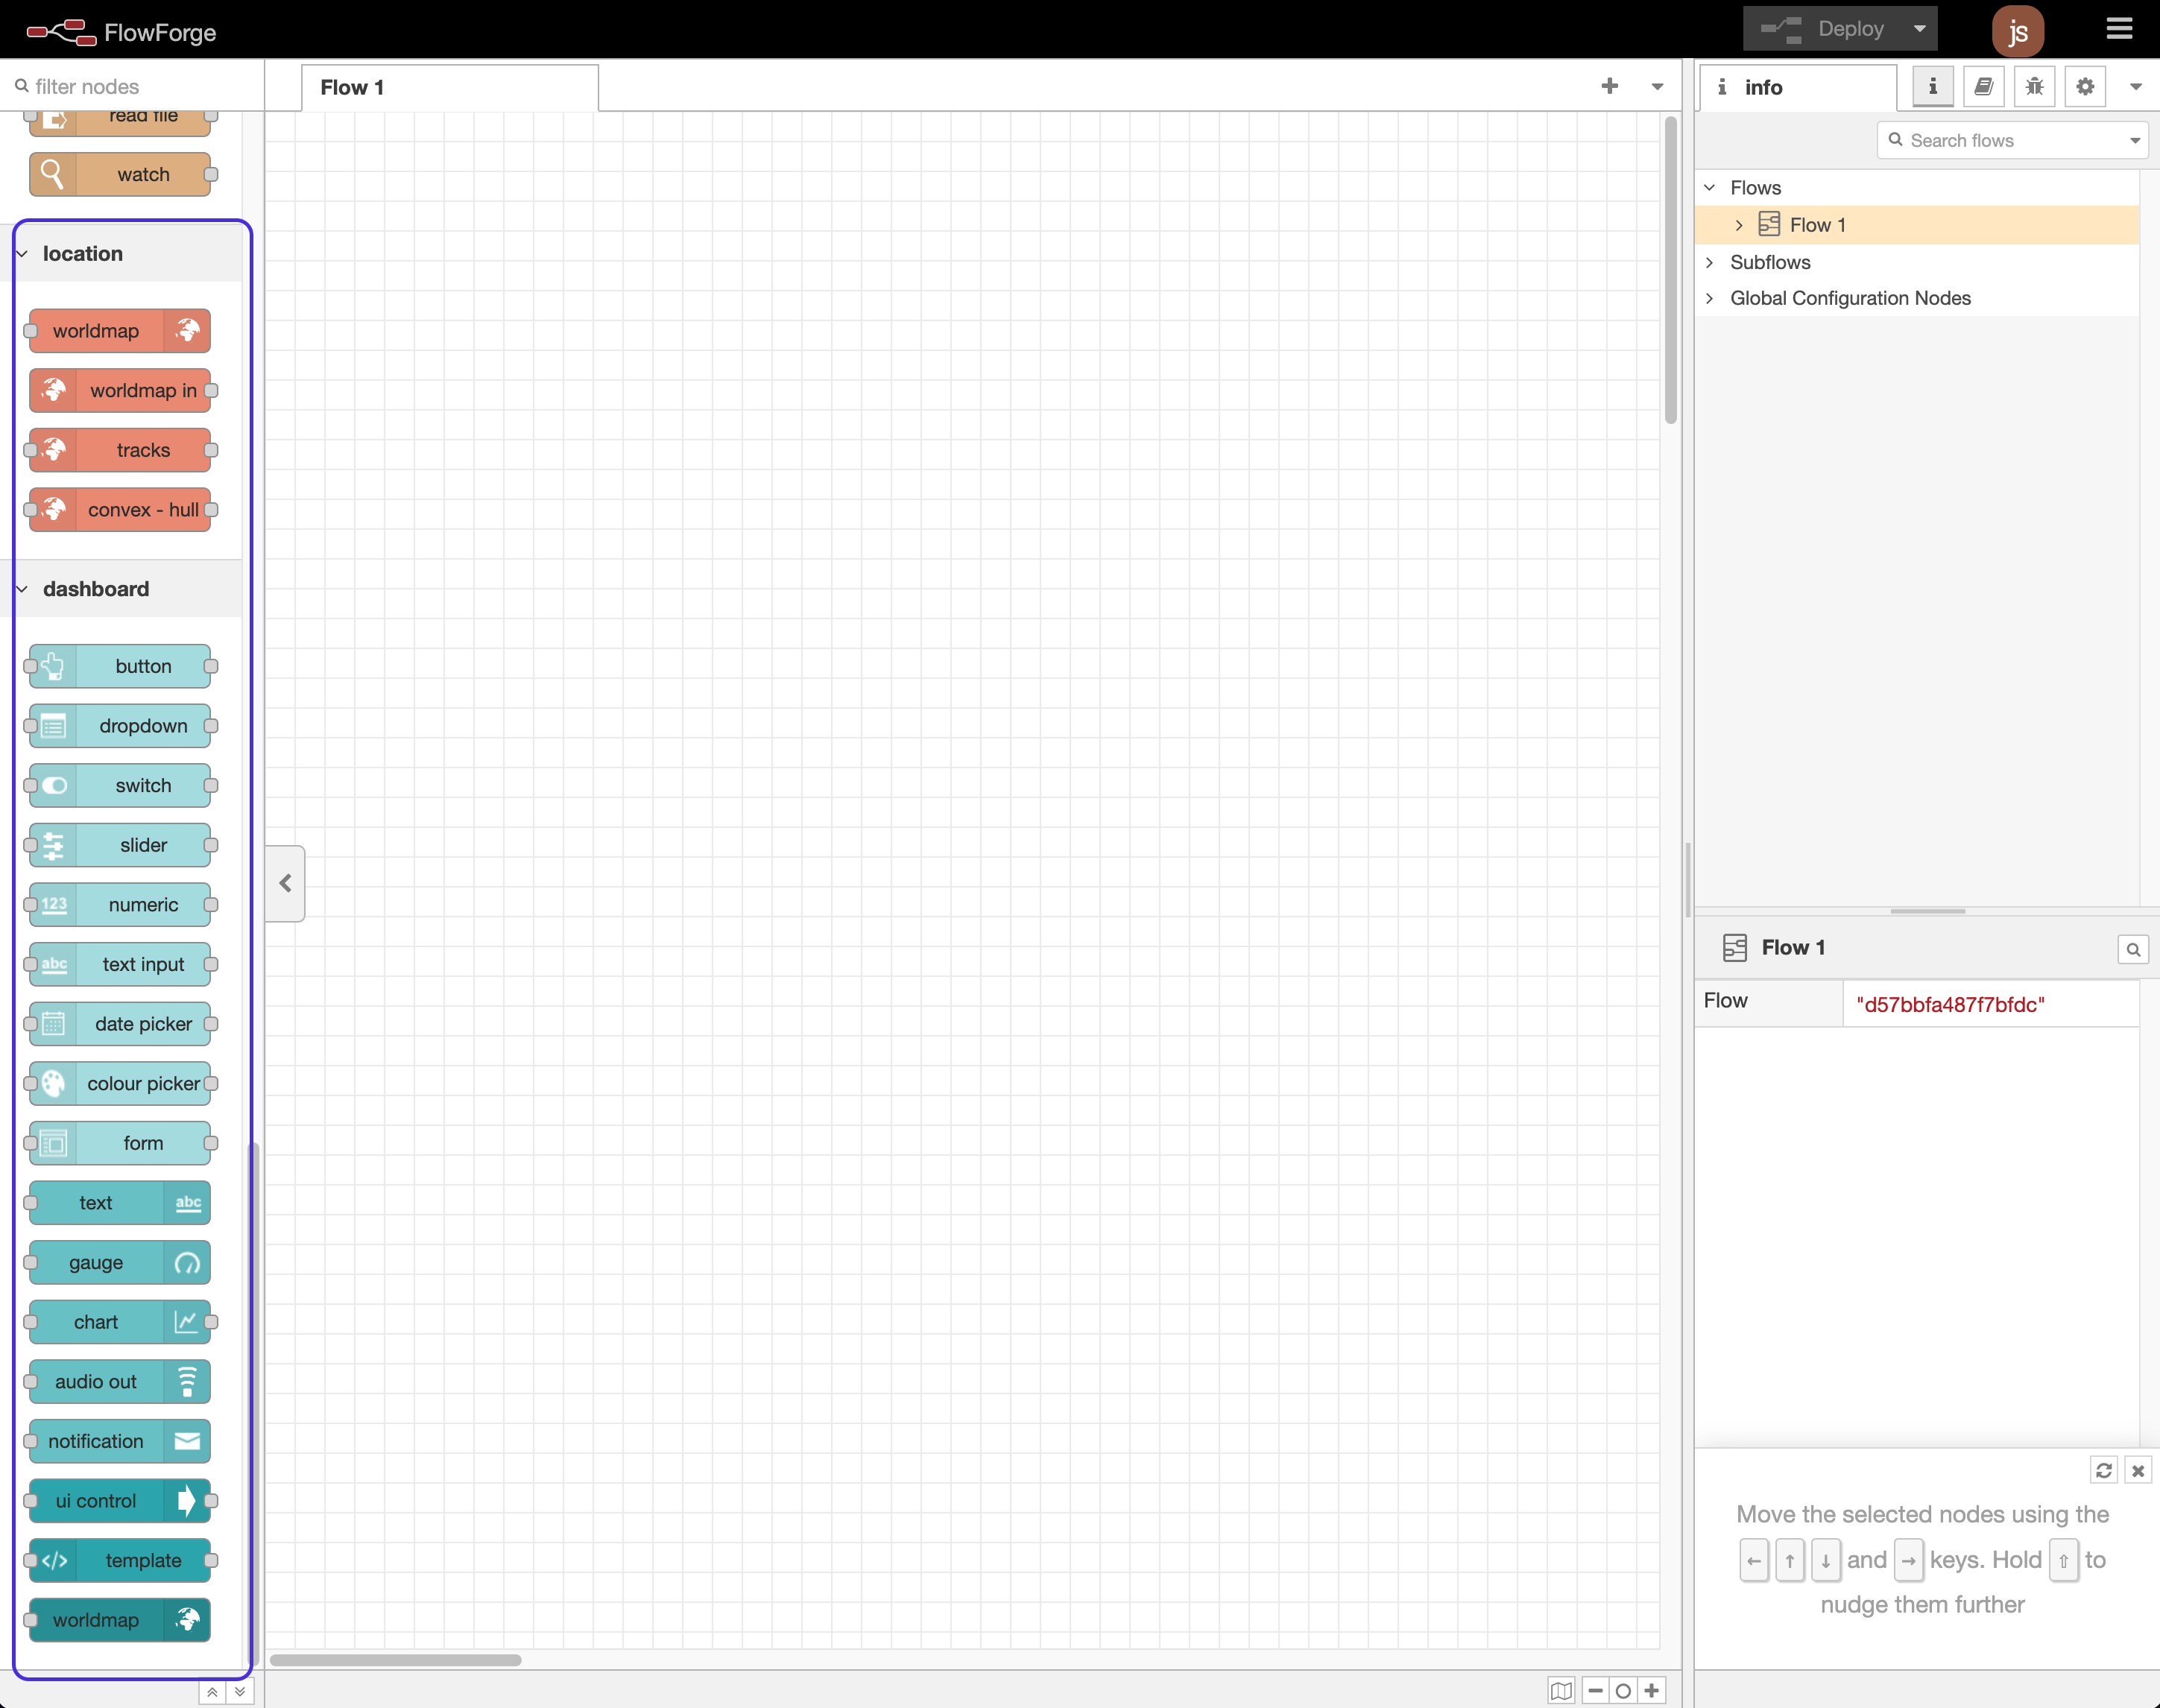
Note: Because of an issue with the Dashboard and worldmap nodes, you may not see the dashboard worldmap node (shown as the last node in the figure above). If this happens, simply restart Node-RED and refresh the page in your browser, it should then appear.
Step 3. Start building your flow
To start off, lets first get our MQTT Subscription node and a debug node hooked up so that we can test that our connection is working.
- Scroll through the nodes on the palette on the left hand side, looking the the
mqtt innode (It’s in the network category). Then drag it onto the canvas. - Double Click on the node that’s now on your canvas, a panel should open up on the right side.
- Click the pencil icon next to the server select box to add a new server. In the new window, set the server as
mqtt.mas400.comand the port as1883. Then click Update.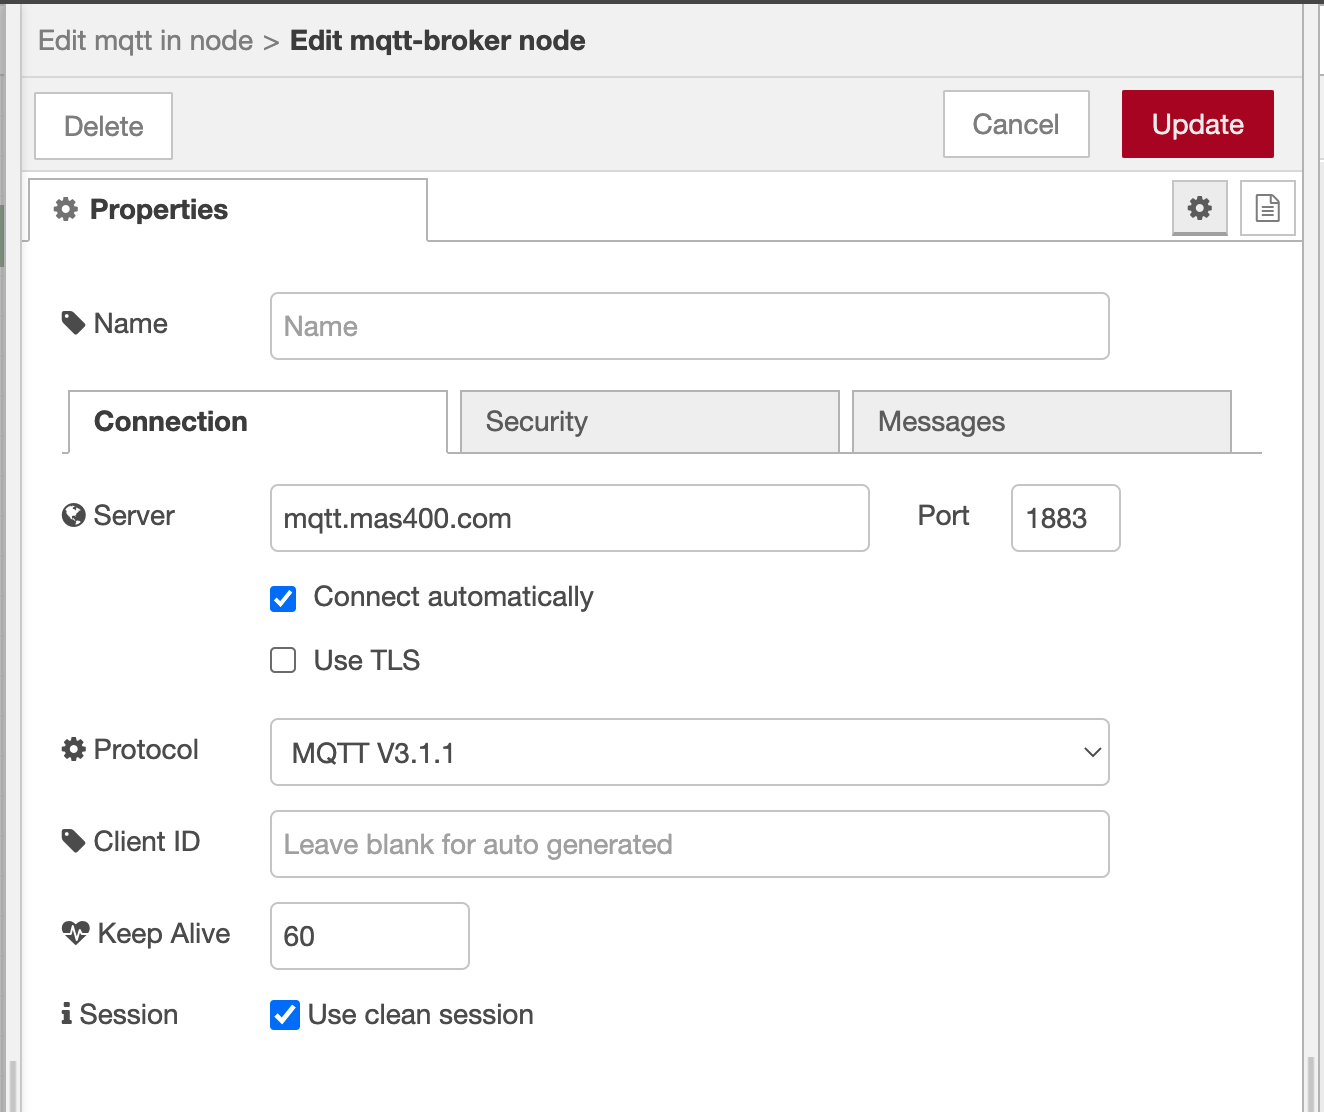
- Make sure the Action is: ‘Subscribe to a single topic’ and set the Topic to:
status/JSONand change the Output to ‘a parsed JSON object’.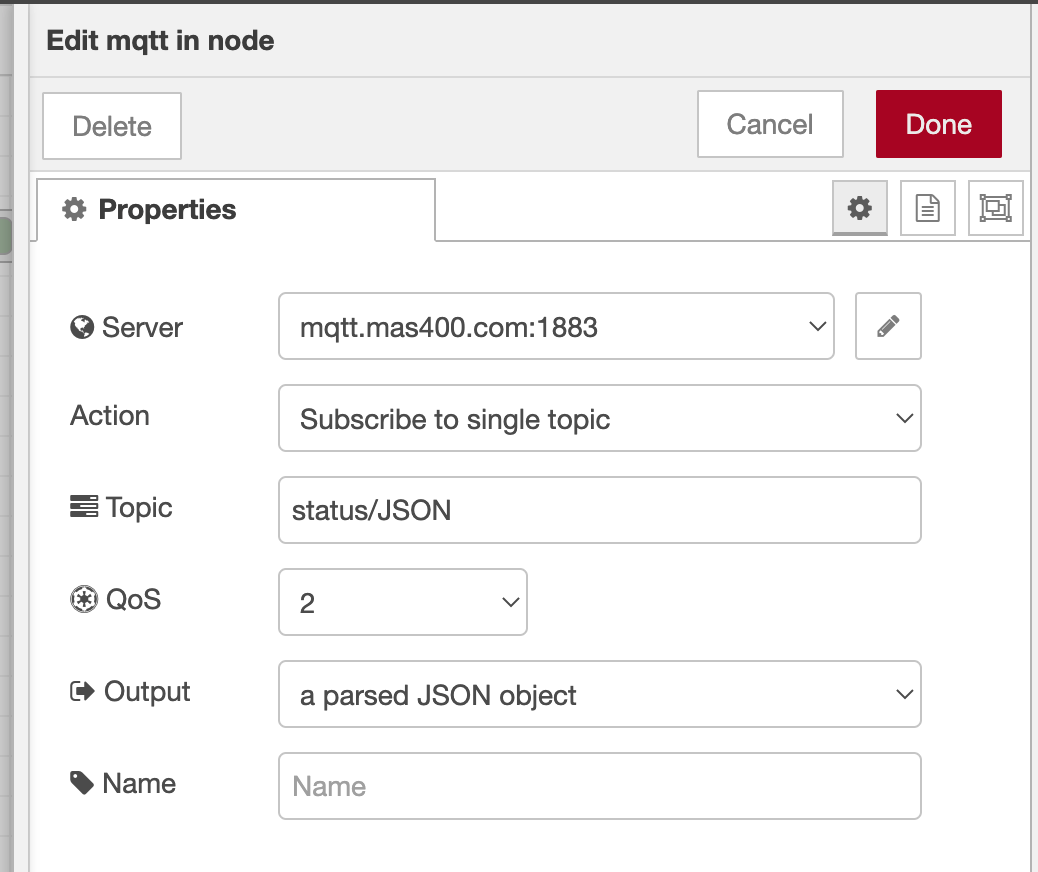
- Click Done.
- Drag a debug node onto the canvas.
- Drag a wire from the mqtt in node to the debug node (from the little grey boxes on the end of the nodes). And click the Deploy button.
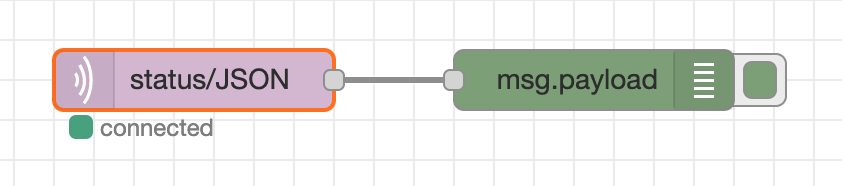
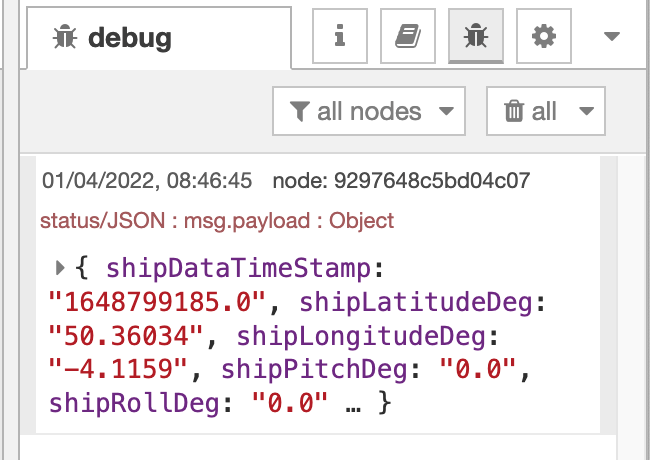
Shortly after deploying your flow, you should soon see some data appear in the debug panel on the right side of the screen (The tab with the little bug in it).
Step 4. Mapping the MAS
Great Job! Now that we’re getting data from the live data feed, we need to do something with it. Lets start off by plotting the poition, bearing and speed of the MAS on a MAP of the world so that you can track its progress.
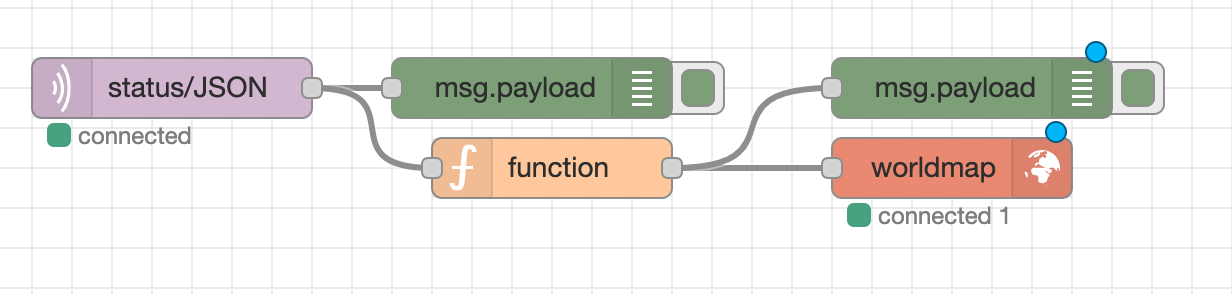
- Start off by finding the ‘worldmap’ out node in the pallet and dragging it onto the canvas, along with a ‘function’ node. Drag a wire from the MQTT subscription node and into the function node, then from the function node into the worldmap node. It can also be handy to add another debug node and draw an extra wire from the function node to that as well so that we can see whether we are correctly modifying the messages.
- Double click on the function node to bring up it’s edit window. In order for the Map node to understand where the MAS is, we need to convert the incoming status messages into something that it can understand, this is what we will be using the function node to do. The function node contains custom javascript that you write and will pass incoming messages through it, and send the result out of the right hand side of the node. Replace all of the code in the function node with the code below and click Done:
var wmPld = {
    "name" : "Mayflower 400",
    "lat" : parseFloat(msg.payload.shipLatitudeDeg),
    "lon" : parseFloat(msg.payload.shipLongitudeDeg),
    "speed" : parseFloat(msg.payload.shipSpeedOverGroundMS),
    "bearing" :parseInt(msg.payload.shipHeadingDeg),
    "icon" : "mayflower",
    "photoUrl" : "https://jpwsutton.github.io/mayflower_autonomous_ship_data/assets/images/mas_header.jpg",
    "Update Time" : msg.payload.date,
    "weblink" : "https://mas400.com/dashboard",
    "layer" : "MAS400"
}

flow.set('latestAIS', wmPld);
msg.payload = wmPld;
return msg;
- At this point, it would also be good to change some of the map settings to make it work better for our needs. Double click on the worldmap node to open it’s properties. Then set the “Auto-pan’ setting to ‘Enable’. You can also set the initial poisiton of the Map (e.g. Plymouth) by entering a prefered Latitude and Longitdue, as well as changing which types of map are available.
- You should now have something similar to the following on your canvas, once you are happy, click deploy.
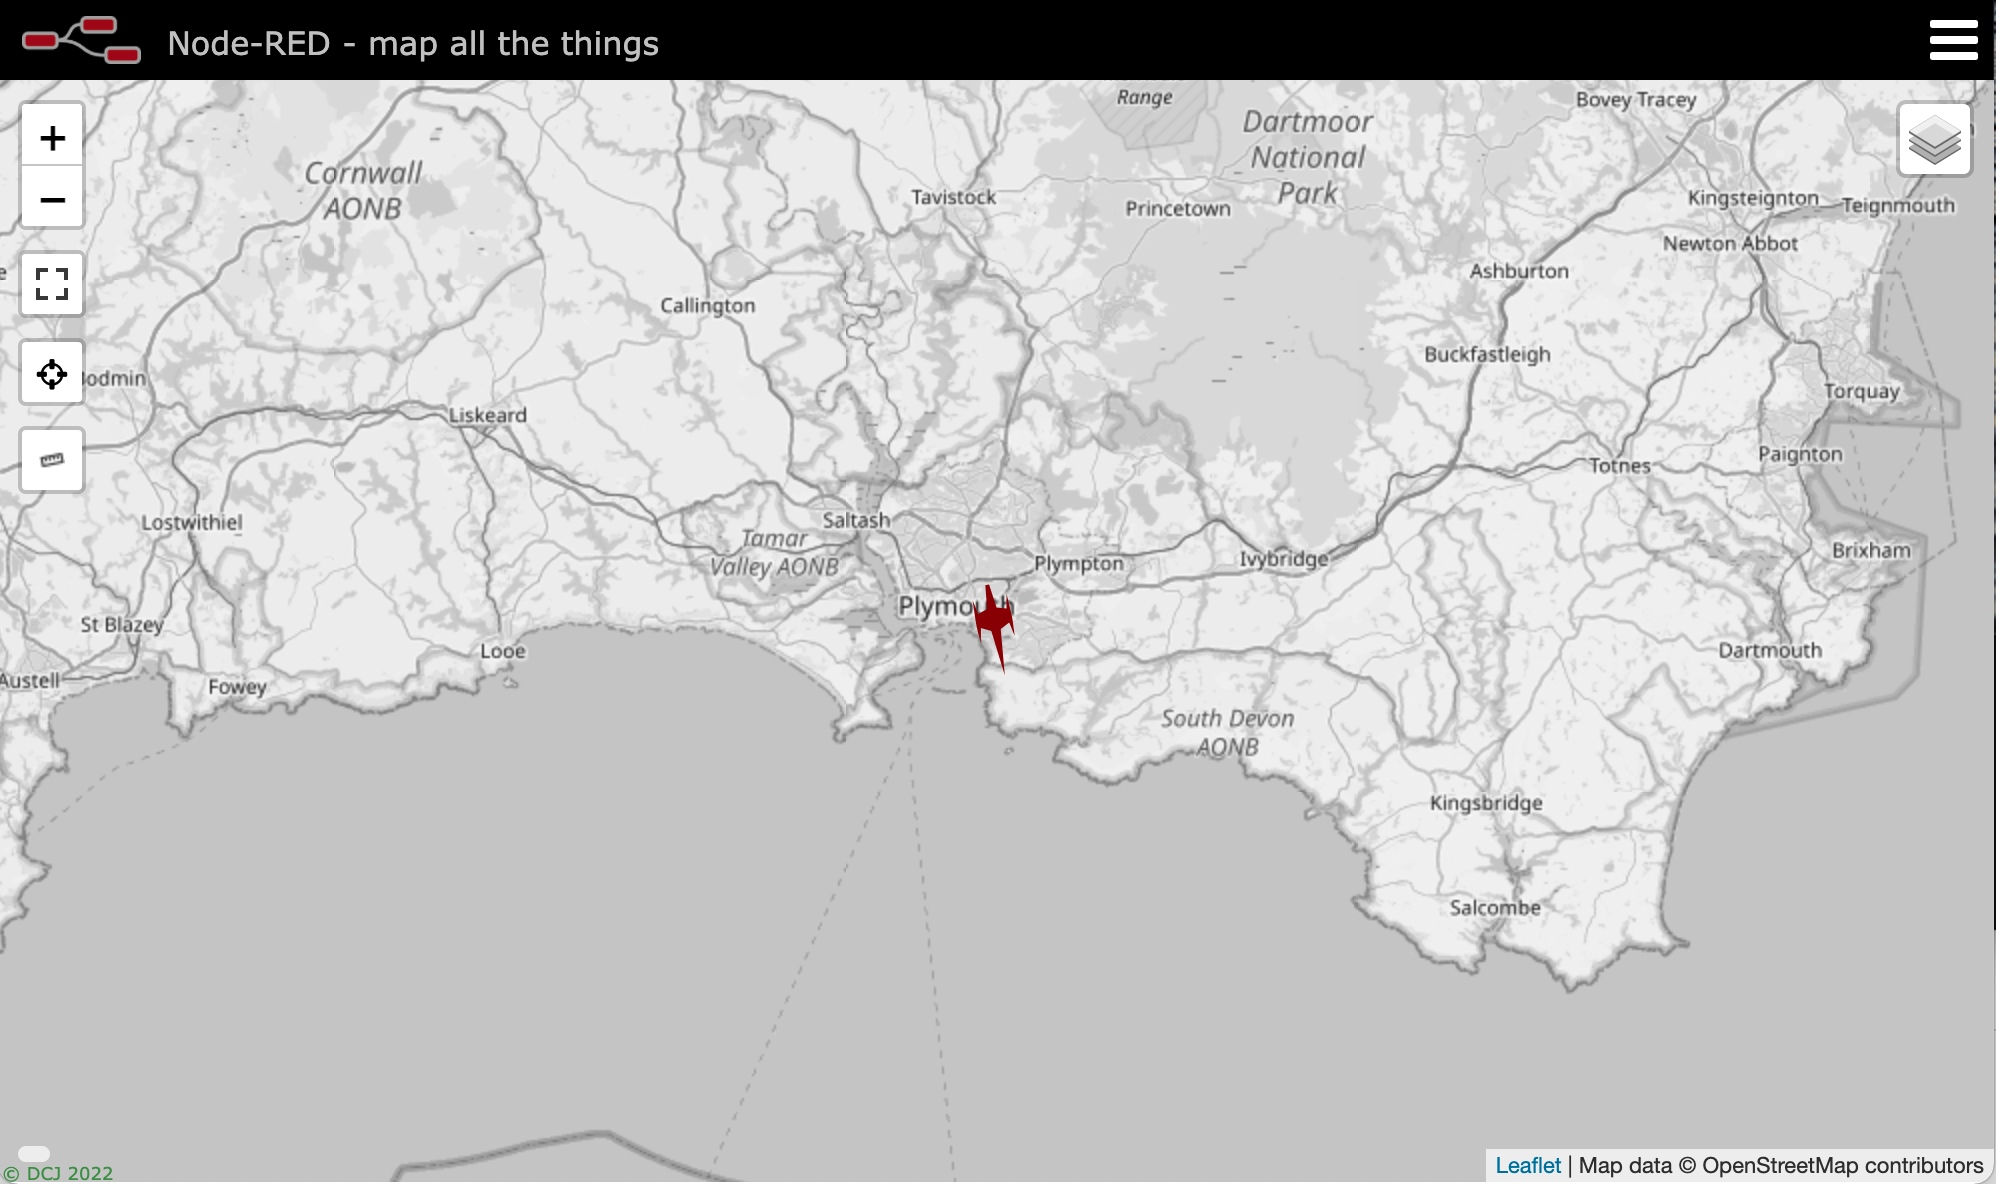
- Now, you can navigate to the Map view, Either use the keyboard shortcut
⌘⇧m - ctrl-shift-m, or go to http://localhost:1880/worldmap. You should shortly see a little MAS appear on the map!
If you click on it, you’ll see a little information popup:
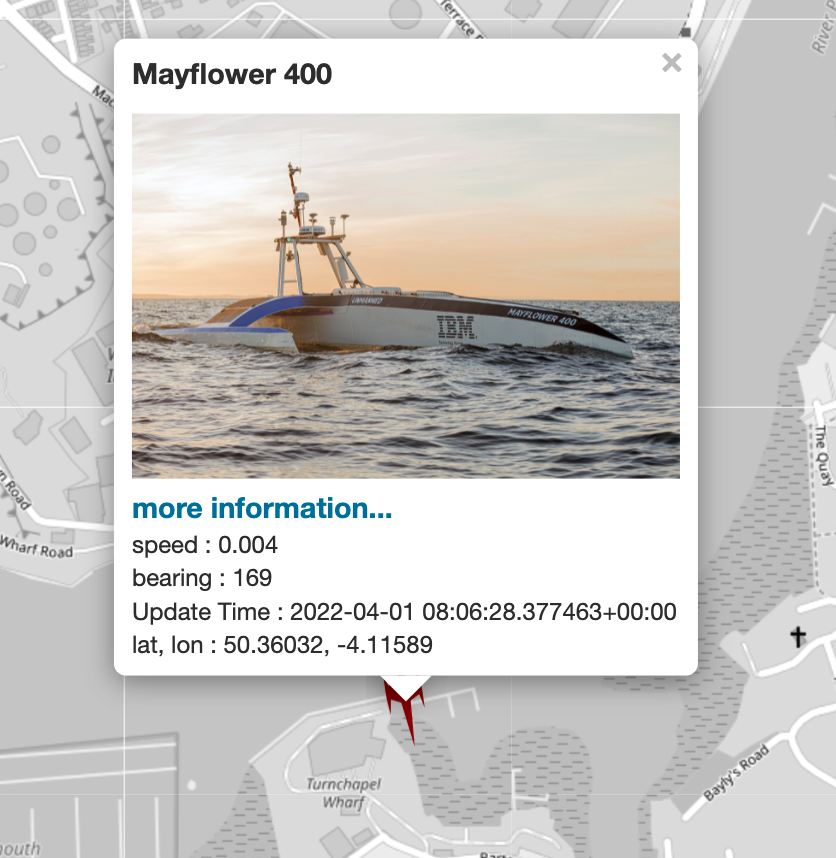
The little MAS logo should be pointing in the same direction of the real ship. If it’s moving, then you’ll also see a line in the direction of movement. The length of the line should depict where the MAS will be in one minute if it continues to travel at the current speed.
Step 5. Happy Trails
Just seeing where the MAS is located is a good start, but it would be great to see where it’s been too. Fortunately there is a node that will let us generate a trail to display on the map!
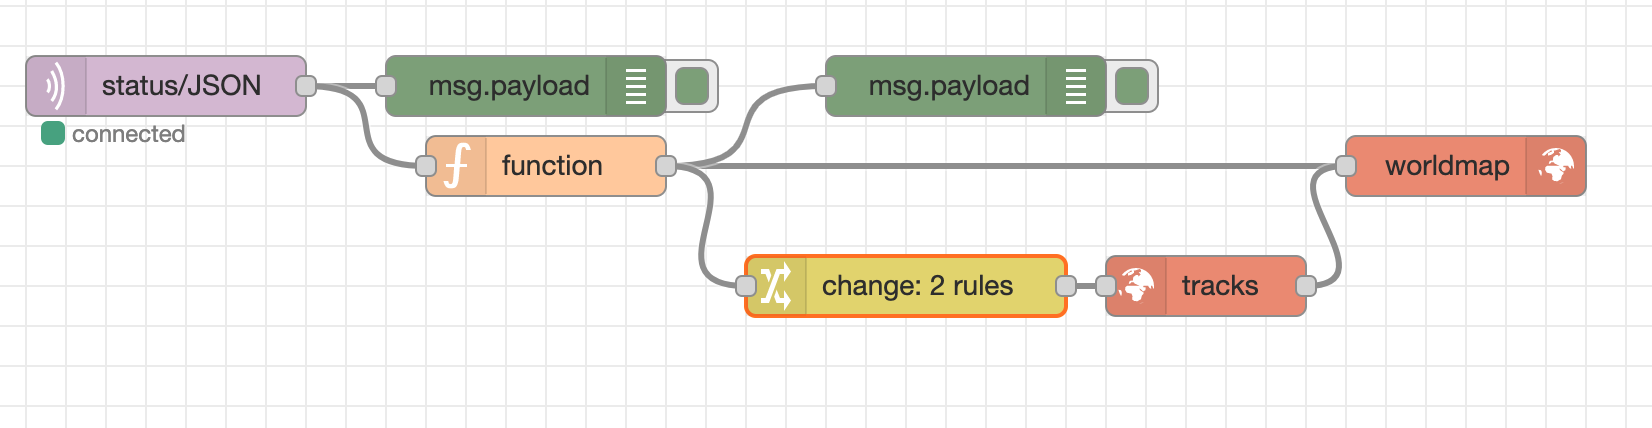
- Drag a change node and the tracks node onto the canvas and draw a wire from the output of the function node into the change node, from the change node to the tracks node and then from the tracks node into the worldmap node.
- Double click the change node and add the following rules then click deploy.
- Set
msg.payload.weightto 1 - Set
msg.payload.dashArrayto 8,8 The flow should now look like this:
- Set
You’ll need to wait until the MAS heads out on a sea trial, or voyage. but when it does, you should see a little dotted trail behind it!
That’s all for now!
You should now have a live map of the MAS that shows you where it’s been, which direction it’s pointing and how fast it’s going. Have a play with the worldmap view and the settings for the node, you’ll find there are loads of ways you can customise it!
In the next part of this tutorial, we will build a dashboard that visualises even more information about the MAS!